
Key findings
- Korea’s first-half 2025 survey shows more eligible users alongside lower cash balances and turnover.
- Audience size and intensity of capital deployment can move in different directions.
- Ratios of aggregate statistics are not observed individual behavior.
More eligible users, less cash and trading
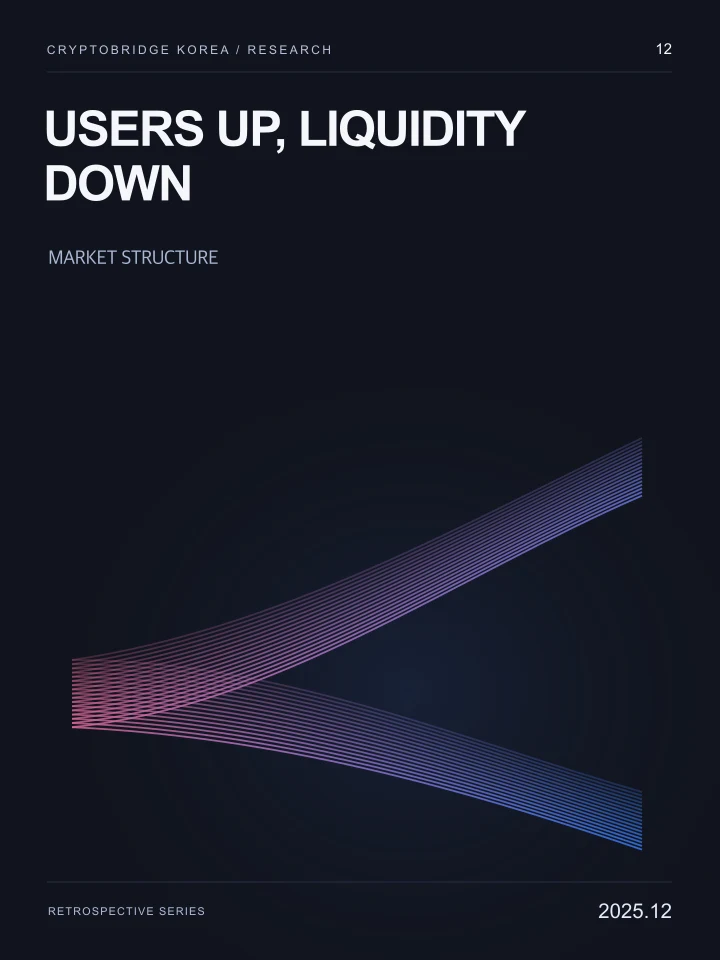
The September 2025 FSC comparison shows eligible users rising from 9.70 million to 10.77 million. Won deposits fell from KRW 10.7 trillion to 6.2 trillion and average daily trading from 7.3 trillion to 6.4 trillion. Audience expansion and weaker capital intensity occurred together. [1]
Neither a simple growth nor decline narrative fully describes this combination. New accounts can coexist with lower balances or activity among existing participants. Public aggregates cannot identify each cause’s contribution.
| Measure | H2 2024 | H1 2025 | Direction |
|---|---|---|---|
| Eligible users | 9.70 million | 10.77 million | Up |
| Won deposits | KRW 10.7 trillion | KRW 6.2 trillion | Down |
| Average daily trading | KRW 7.3 trillion | KRW 6.4 trillion | Down |
| Holdings below KRW 1 million | 6.84 million users | 8.04 million users | Up |
FSC, 30 September 2025. Users and balances are half-year-end stocks; trading is a daily average. Provider-submitted survey data, not nationally approved statistics. [1]
Normalization makes the divergence visible
Setting H2 2024 to 100 produces indices of about 111 for users, 58 for deposits and 88 for turnover. This compares directions without adding incompatible units.
It does not establish lower user quality. Large-balance participants, prices, events or activity elsewhere could influence the aggregates. An index describes the phenomenon, not its cause.
CBK calculations from the FSC comparison: 10.77/9.70, 6.2/10.7 and 6.4/7.3 × 100. [1]
Implications for a Korea entry budget
Broad awareness and helping an existing audience use a product respond to different conditions. More reachable people can coexist with less willingness to deploy funds. Better awareness metrics do not justify proportionate increases in trading-oriented spending.
Capital-light information, community and workflow products can still create value when turnover weakens. National liquidity is not the demand metric for every service.
Why a December topic uses first-half data
Ignoring publication lags inserts unavailable information into historical decisions. This December 2025 topic uses the earlier-published H1 survey to analyze a structural divergence, not to describe every subsequent market condition.
Later releases can revise comparison values. Calculations here consistently use the September release’s own table rather than stitching together different vintages. Consistency can matter more than time-series length. [2]
A larger denominator changes the apparent average
Dividing deposits by eligible users gives roughly KRW 1.10 million and KRW 0.58 million. It does not show that a typical person withdrew KRW 0.52 million. The composition of new and existing users and the balance distribution are unobserved.
A few large holders reducing funds while many small holders join could generate the pattern. So could modest reductions across many accounts. Interpretation should remain at the resolution the evidence supports.
| Interpretation | H2 2024 | H1 2025 |
|---|---|---|
| Deposits / eligible users | About KRW 1.10 million | About KRW 0.58 million |
| What it is | Ratio of published aggregates | Ratio of published aggregates |
| What it is not | Observed average withdrawal | New-customer investment budget |
Recalculated from the 30 September 2025 FSC comparison. Not individual observations. [1]
What evidence is needed next?
Product decisions need cohort behavior, balance distributions and the roles of new and existing users. Where public data cannot provide them, appropriately scoped interviews or consent-based product records may help. Identify the gap rather than converting a national statistic into an individual preference.
The same discipline remains useful if users and liquidity rise together again. Keep denominators and observation rules consistent across favorable and unfavorable markets.
Scope & limitations
Individual provider and customer observations are unavailable. Aggregate indices do not establish personal behavior or causes of overseas capital movements. Stock dates and trading-flow windows remain distinct.
CryptoBridge Korea analysis based on public materials. Source facts are distinguished from interpretation and hypothetical calculations. References to organizations or projects do not imply their sponsorship or review of this paper.
Sources & scope
- FSC / KoFIU, H1 2025 Virtual Asset Service Provider Survey ↗H1 2025 and end-June balances. Comparative values are taken from the same release.
- FSC / KoFIU, H2 2024 Virtual Asset Service Provider Survey ↗H2 2024 and end-December balances. Distinguish original releases from later revisions.