

Key findings
- USDC circulation rose 12.7% between January and March 2025 month-ends. Reported reserves exceeded circulation at all three snapshots; the excess remained near $64.9 million.
- Asset value, scheduled maturity and payout availability are different measurements. A reserve chart cannot supply a customer’s redemption time.
- A credible cash-out promise must identify the holder’s actual route, executable price, bank availability and destination currency.
1. What does “fully backed” actually establish?
A stablecoin can satisfy a reserve test while a holder still waits for bank funds. These outcomes are compatible because they measure different things. One describes the assets behind outstanding tokens at a specified time. The other describes a transaction through contracts, accounts, payment rails and, sometimes, a currency conversion.
USDC provides a useful case study because its public reports disclose both a circulation definition and a detailed asset reconciliation. At the three month-ends examined here, reserve fair value exceeded reported circulation. From 31 January to 31 March 2025, circulation increased from $53.219 billion to $59.976 billion, a calculated 12.7% rise. The absolute excess changed by only $74,695, remaining near $64.9 million. [1] [2] [3]
The lower panel isolates that small difference rather than exaggerating it on a truncated reserve chart. Expressed relative to circulation, the excess fell from 12.19 to 10.83 basis points. This mostly reflects denominator growth; it is not, by itself, evidence that the assets became riskier. One basis point is 0.01 percentage point. A ratio of 100.1083% is different from an excess of 10.83%.
Interpret the result narrowly. The difference between two reported balances is not a disclosed regulatory capital ratio, an insurance pool or a promised cushion available to each holder. These snapshots support a backing claim under the report’s criteria. They do not measure a stressed liquidation loss, an individual right of recovery or continuous redemption capacity.
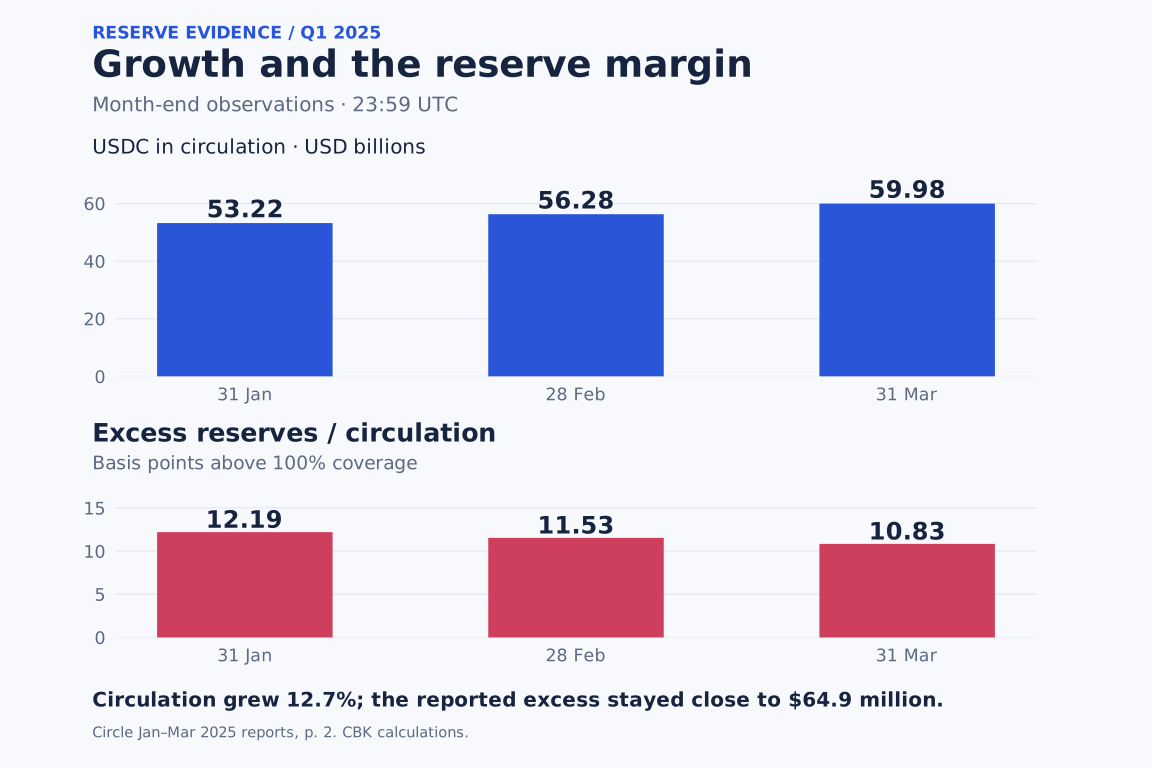
Sources: monthly USDC reports, p. 2. Month-end observations at 23:59 UTC. Excess = reserves minus circulation; basis points = excess / circulation × 10,000. CBK calculations, rounded only for display. [1] [2] [3]
Read the diagram description
At January, February and March 2025 month-ends, circulation was $53.219bn, $56.284bn and $59.976bn. Reserve excesses were $64.861m, $64.876m and $64.935m, equivalent to 12.19, 11.53 and 10.83 basis points of circulation. Both bar-chart axes start at zero; the panels use different, explicitly labeled units.
2. Follow the accounting bridge before drawing a pie chart
At 31 March, the report reconciles $24.863 billion of Treasury securities, $30.815 billion of Treasury repo and cash to $60.041 billion of net reserves. Crucially, it also includes negative timing and settlement adjustments. Ignoring those lines would overstate the asset total. [3]
The reconciliation below preserves the signs. Treasury repo is a secured lending position, not a second pile of Treasury securities that should be counted alongside its collateral. The fund’s cash and the separate bank cash are also different locations. For the equivalent accounting categories, the January report explains overnight Treasury-backed repo and adjustments for unsettled activity, cut-off differences and other accruals. [1]
The analytical distinction is location versus availability. Knowing that an asset is inside a fund helps identify the next institution in a payout route. It does not tell us which account can send a payment now. Likewise, a negative settlement adjustment is not automatically a credit loss: it is a reconciliation line whose meaning depends on the underlying transactions.
A useful due-diligence question therefore has two parts: can the asset be valued and realized without material loss, and can the resulting funds reach the payout account before the customer’s deadline? A single allocation graphic cannot answer both. The waterfall is an accounting map, not a promise that each positive bar is immediately spendable cash.
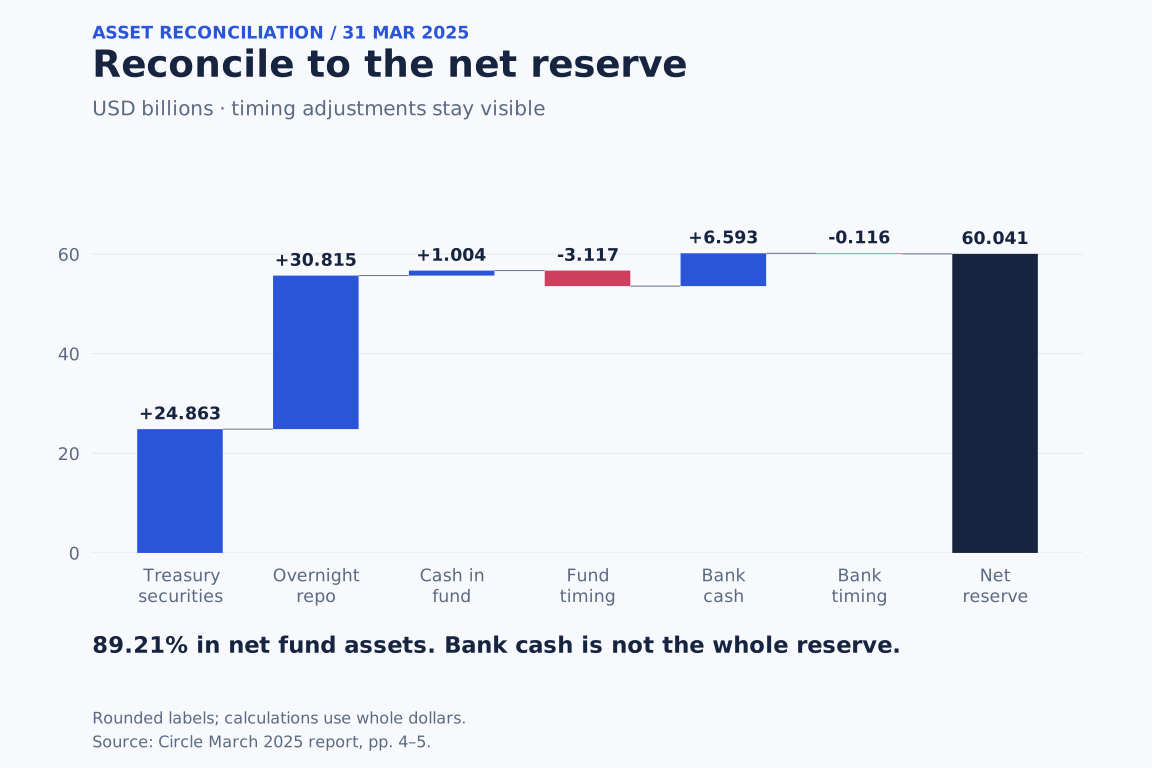
Source: March 2025 report, pp. 4–5. Values shown in USD billions. Negative entries retain their reported sign. The original whole-dollar values and reconciliation are available in the data download. [3]
Read the diagram description
The March reconciliation adds $24.863bn Treasuries, $30.815bn repo and $1.004bn fund cash; subtracts $3.117bn fund timing adjustments; adds $6.593bn bank cash; then subtracts $0.116bn bank timing adjustments. Net reserves are $60.041bn. Net fund assets comprise 89.21% of that total. Mobile uses signed contribution bars instead of a compressed waterfall.
3. Short maturity helps—but is not a payout clock
A maturity profile adds information that broad asset categories conceal. We group the sixteen disclosed Treasury positions by the calendar days between the observation date and each scheduled maturity. On that basis, 52.46% of the listed Treasury fair value falls within thirty days, and the fair-value-weighted time to maturity is 29.6 days. [3]
These are calculations for the direct Treasury positions only. They are not the weighted average maturity of the entire reserve or the fund, and they exclude repo and cash. The line items sum to one dollar more than the report’s Treasury subtotal; the dataset preserves that source discrepancy rather than silently altering a holding.
Maturity is neither a mandatory waiting period nor a guarantee of early availability. A security can potentially be sold before it matures; doing so introduces execution and settlement questions. Waiting for maturity avoids that particular sale decision but does not eliminate the bank and operational steps that follow. The relevant evidence for a payment product is the actual cash conversion process under the intended conditions.
The distinction also changes stress testing. A scenario that reduces asset proceeds tests valuation and loss exposure. A scenario that delays access to unchanged proceeds tests liquidity and payment continuity. Applying the same haircut to both hides the difference between money lost and money temporarily unavailable.
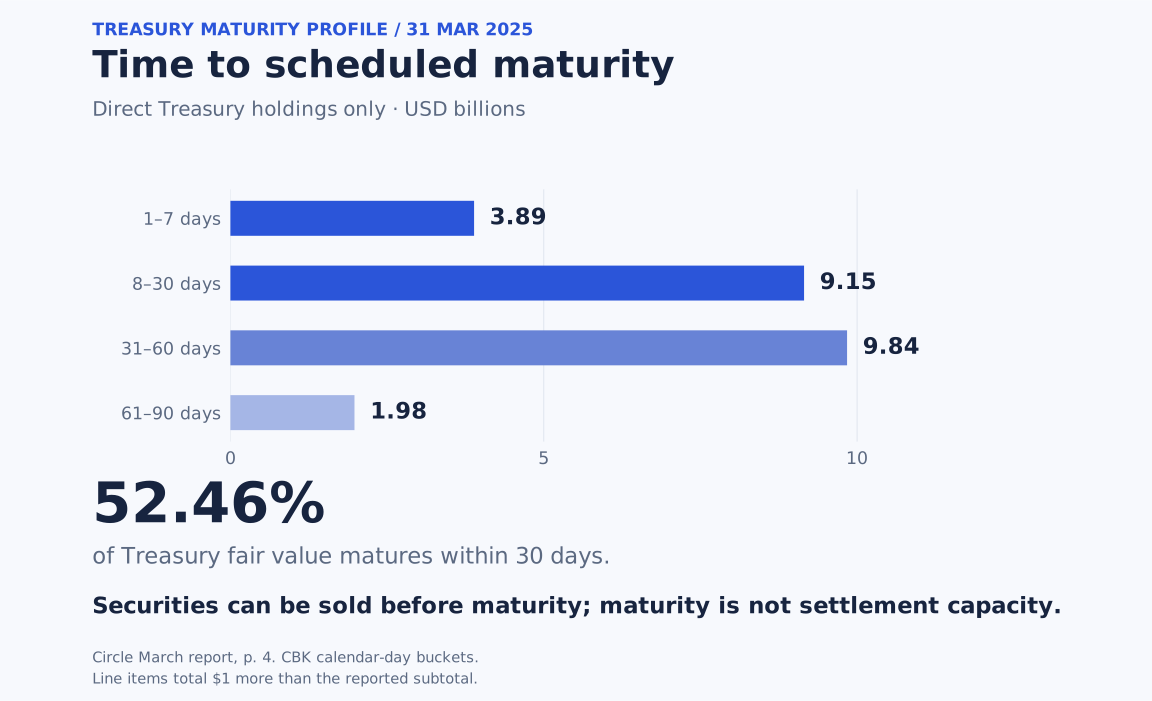
Source: March report, p. 4. Original CUSIPs and dates are supplied in the holdings CSV. Buckets use calendar days; percentages and weighted maturity use the sum of the sixteen reported line items ($24,862,566,988), which is $1 above the printed subtotal. [3]
Read the diagram description
Grouped Treasury fair values are $3.888bn maturing in 1–7 calendar days, $9.154bn in 8–30 days, $9.840bn in 31–60 days and $1.980bn in 61–90 days after 31 March 2025. The first two groups represent 52.46% of summed line-item fair value. Weighted days to maturity are 29.6. No redemption-time claim is inferred.
4. The same token can give two holders different exits
Reserve quality does not determine who can send an instruction to the issuer. Circle’s non-EEA USDC Terms, updated 15 October 2026, make direct redemption conditional on an eligible Circle Mint account in good standing. A holder without that account must qualify and register before redeeming directly. This is a current legal snapshot, not a reconstruction of March 2025 rules. [4]
A market sale follows another route. The holder needs an available counterparty or trading venue, an executable price for the intended size, and a withdrawal process. An issuer’s nominal redemption rate and a third-party bid are not interchangeable prices. The diagram separates those routes without assuming that every holder has access to both.
This distinction explains why an arbitrage opportunity is not automatically a usable retail exit. An institution with established access may be able to buy tokens and submit them for redemption. A different holder may have no such access, or may need cash before the institutional route completes. The existence of the first route does not remove the second holder’s deadline or costs.
For a Korean business with a KRW invoice, the endpoint should be KRW available in its own permitted bank account. A USD wire can be an intermediate step, while a local venue might offer a different conversion route. Neither should be assumed available from a global token’s presence alone. Account eligibility, venue rules, bank arrangements and the actual currency conversion must be checked for the intended operator.
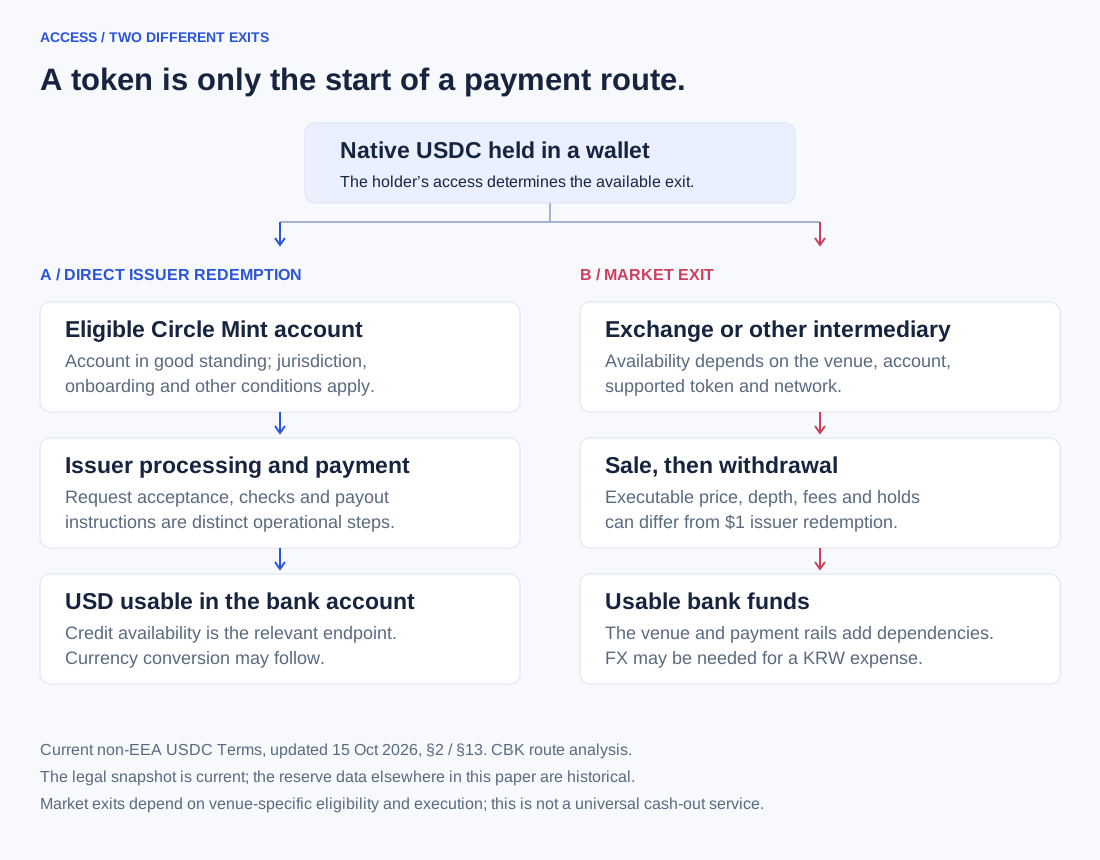
Direct-redemption conditions: current non-EEA USDC Terms, §§2, 4 and 13. Market-exit and destination-currency layers are CBK analysis; venue availability and specific legal eligibility are not established by this diagram. [4]
Read the diagram description
Route A starts with eligible Circle Mint access, continues through issuer processing and ends with usable USD in a bank account. Route B starts with an available exchange or intermediary, continues through a market sale and withdrawal, and ends in usable bank funds. A separate FX step may be needed to meet a KRW expense. The diagram describes dependencies; it does not prescribe exact transaction sequencing or guarantee either route.
5. March 2023: asset protection and service recovery were distinct
The SVB episode provides a historical example of the difference between a protected deposit and a restored payment route. On 12 March 2023, US authorities announced that SVB depositors would have access to their money from 13 March. Circle identified a $3.3 billion USDC reserve deposit at SVB and said it would become available when banks opened. [5] [6]
Circle’s subsequent update reported a new domestic wire partner on 14 March, expanded international wire routes on 15 March, and substantially cleared minting and redemption backlogs by the close of US banking operations that day. It also reported $3.8 billion redeemed and $0.8 billion minted since Monday morning. The derived net redemption over that window is $3.0 billion. [7]
Three clocks appear in these disclosures: the policy decision about deposit access, the restoration of operating routes, and the processing of requests. They are related, but a success at one layer does not timestamp completion at the next. That is the operational lesson of the case; the sources do not establish an individual customer’s waiting time.
Nor can the flow figures be converted into a reliable daily throughput rate or a worst-case service level. They are cumulative issuer disclosures, with no transaction-level timestamps or distribution of delays. Dividing by the number of days would create an average over an unusual recovery window, not a demonstrated limit of the system. The authorities’ action concerned bank depositors; it should not be generalized into deposit insurance for stablecoin holders. [5] [4]
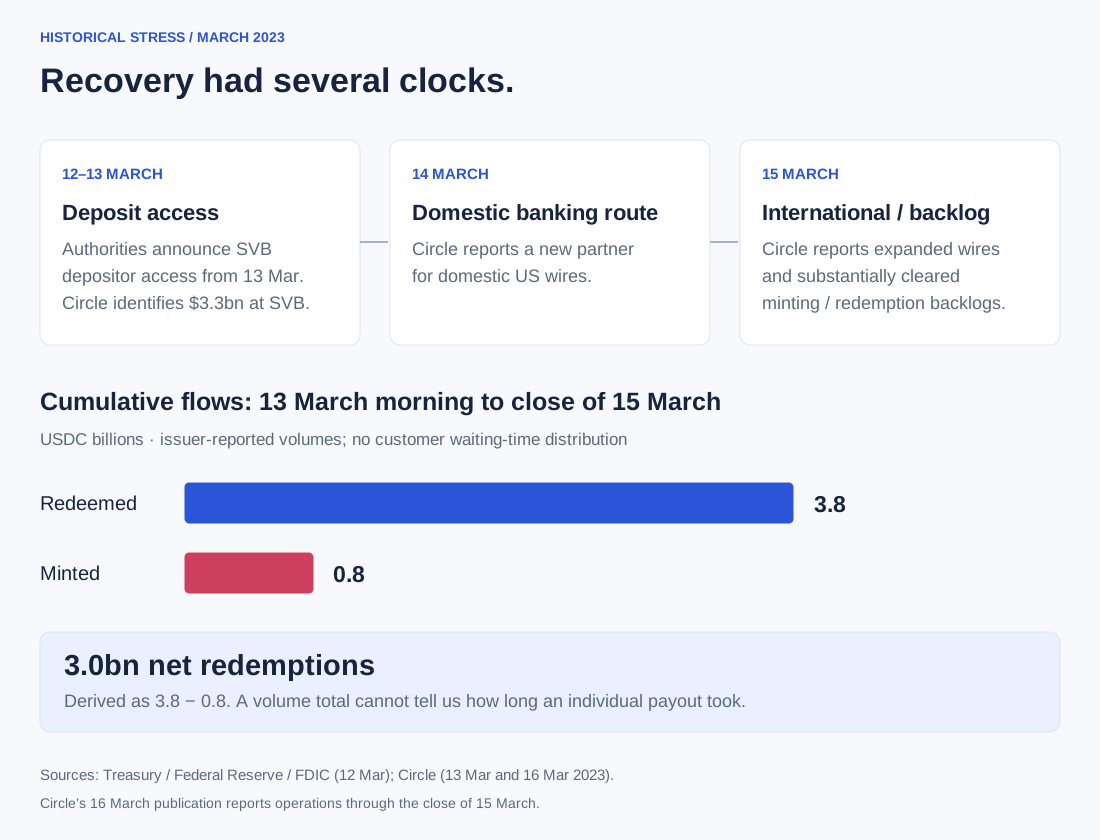
Sources: US authorities’ 12 March statement; Circle’s SVB release; operating update published 16 March with a 15 March observation cutoff. Timeline spacing is editorial, not an elapsed-time scale. No market-price series or customer latency is implied. [5] [6] [7]
Read the diagram description
The timeline records the 12 March authorities’ announcement of access from 13 March, Circle’s 14 March domestic wire route and its 15 March international routes and backlog update. The flow bars compare cumulative 3.8bn redemptions and 0.8bn minting from Monday morning through 15 March. Their difference is 3.0bn; no intermediate daily values are invented.
6. Measure the cash-out promise at the customer’s deadline
The evidence suggests a more useful operating test than “is the token backed?” Specify a holder, a quantity, a route, a destination currency and a deadline. Then measure whether the promised funds are available at that endpoint. A route that is adequate for treasury rebalancing may be inadequate for payroll due that afternoon, even if the underlying reserve assets are identical.
Record the request, onchain receipt, review completion, payout instruction and bank-available timestamps with time zones. Some stages overlap, so adding their separately measured durations can double-count time. End-to-end elapsed time should come from the first agreed start event and the final usable-balance event. Investigate the critical path rather than presenting blockchain confirmation speed as the whole payment speed.
A useful dashboard would report both the share of accepted requests meeting the agreed deadline and the distribution of completed-request delays. It should separately disclose rejections and still-pending requests; excluding them can make service quality look better precisely when a queue grows. The public reserve reports used here do not provide these data, so this paper leaves those cells unmeasured.
An operational contingency should also address shared dependencies. Two branded providers may rely on the same receiving bank, liquidity provider or approval process. A second logo is therefore not sufficient evidence of an independent backup. Identify the shared failure point and test the alternative route at a small, appropriate scale before treating it as available capacity.
| Question | Evidence to request | What the reserve report cannot supply |
|---|---|---|
| Can this holder use it? | Current eligibility, account status and supported network. | Approval of this particular account or transaction. |
| What amount is executable? | A size-specific quote or accepted instruction, including fees. | The market price and capacity available to this holder. |
| When is cash usable? | Bank-available timestamp; pending and rejected requests included. | A payout SLA, percentile delay or weekend guarantee. |
| Does it settle the obligation? | Destination currency, bank access and any conversion step. | Assurance that a USD token settles a KRW expense. |
| Is the fallback independent? | Underlying banks, liquidity providers and approval dependencies. | That two service providers have different failure points. |
CBK operational framework. These are proposed measurements, not reported performance results or a certification of any provider.
7. Data, definitions and reproducibility
The sample uses the second observation in each January–March 2025 report: the month-end at 23:59 UTC. Each PDF also includes an earlier observation, which is not mixed into the chart. Report dates are kept separate from observation dates: the January, February and March reports are signed 27 February, 28 March and 30 April respectively. This is retrospective evidence, not information known at every instant during the quarter. [1] [2] [3]
The circulation denominator follows the report’s definition rather than a generic blockchain supply count. For March, the reconciliation is 61,073,416,469 total tokens on approved blockchains, less 996,628,065 allowed but unissued and 101,016,689 access-denied tokens, giving 59,975,771,715 in circulation. Applying a different denominator answers a different question; it should not be presented as the report’s own coverage ratio. [3]
Every chart is an original CBK visualization. No illustrative data points fill gaps. Displayed amounts are rounded; calculations use the disclosed whole-dollar figures. The Treasury maturity calculation weights calendar days by each listed position’s fair value and excludes all other assets. Source URLs, PDF pages and file hashes are recorded with the downloaded data so the transformation can be checked.
| Observation (UTC) | Circulation (USDC) | Reserve value (USD) | Excess (USD) |
|---|---|---|---|
| 2025-01-31 23:59 | 53,218,939,728 | 53,283,800,358 | 64,860,630 |
| 2025-02-28 23:59 | 56,284,318,550 | 56,349,194,760 | 64,876,210 |
| 2025-03-31 23:59 | 59,975,771,715 | 60,040,707,040 | 64,935,325 |
Exact reported balances and CBK subtraction. Coverage = reserve value / circulation × 100. Excess basis points = excess / circulation × 10,000. [1] [2] [3]
Reproduce the figures
Scope & limitations
This is a USDC case study, not a ranking of stablecoins or an assessment of a specific holder’s legal claim. Reserve observations cover three month-ends in Q1 2025; the banking incident is from March 2023; the non-EEA terms were reviewed as updated on 15 October 2026. The series period 2025-03 is a retrospective label. The paper has no live quotes, current reserve balance, customer-level redemption logs or verified payout-time dataset. Issuer operating disclosures are identified as such. The $1 discrepancy between summed March Treasury line items and the printed subtotal is retained. Nothing here establishes a universal redemption service, a KRW conversion entitlement or principal protection.
CryptoBridge Korea analysis based on public materials. Source facts are distinguished from interpretation and hypothetical calculations. References to organizations or projects do not imply their sponsorship or review of this paper.
Sources & scope
- Circle — January 2025 USDC examination and reserve report ↗PDF p. 1: independent examination scope; p. 2: circulation and reserve value; p. 4: month-end assets; p. 5: accounting notes. Observation: 2025-01-31 at 23:59 UTC. Amounts in USD unless noted.
- Circle — February 2025 USDC examination and reserve report ↗PDF p. 1: independent examination scope; p. 2: circulation and reserve value; p. 4: month-end assets; p. 5: accounting notes. Observation: 2025-02-28 at 23:59 UTC. Amounts in USD unless noted.
- Circle — March 2025 USDC examination and reserve report ↗PDF p. 1: independent examination scope; p. 2: circulation and reserve value; p. 4: month-end assets; p. 5: accounting notes. Observation: 2025-03-31 at 23:59 UTC. Amounts in USD unless noted.
- Circle — USDC Terms (non-EEA holders) ↗Sections 2, 4 and 13 distinguish direct redemption eligibility, third-party pricing and deposit insurance. Current legal snapshot; not evidence of the terms in force in March 2025.
- Treasury, Federal Reserve and FDIC — Joint Statement ↗Announces protection for SVB depositors and access to their money from 13 March. The statement concerns bank depositors, not a blanket guarantee of stablecoin holdings.
- Circle — $3.3 billion USDC reserve deposit at SVB ↗Issuer disclosure of the SVB reserve deposit and expected availability after the authorities’ announcement. Historical incident; not a current bank exposure.
- Circle — March 15 update on USDC operations ↗Issuer-reported cumulative redemptions and minting since Monday morning, plus bank-rail restoration and backlog status. Not independently verified transaction-level latency data.